
Dual milestone: down $1 trillion & below $8 trillion. Fed shed 26% of Treasuries it had added during pandemic QE.
By Wolf Richter for WOLF STREET.
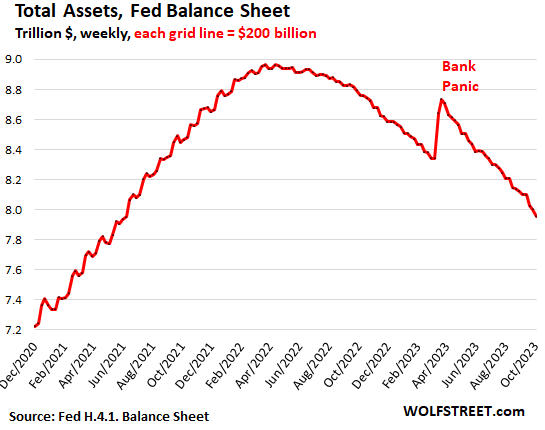
This is a big milestone of the Fed’s Quantitative Tightening (QT): Total assets dropped by $1.01 trillion since peak-QE in April 2022, to $7.96 trillion, the lowest since June 2021, according to the Fed’s weekly balance sheet today.
In September alone, total assets dropped by $146 billion as another big chunk of bank-panic support unwound.
Total assets have now dropped 11.3% from the peak.
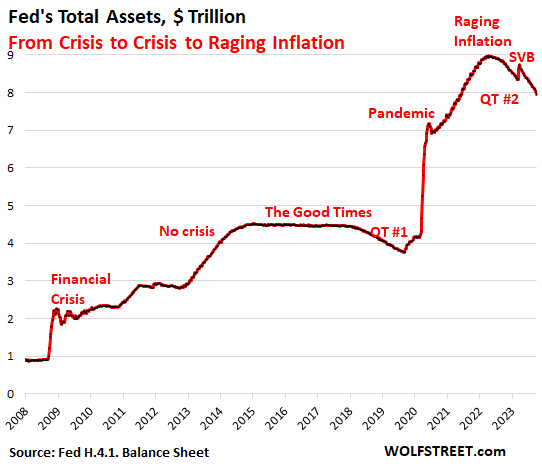
From crisis to crisis to raging inflation:
During QT #1 between November 2017 and August 2019, the Fed’s total assets dropped by $688 billion. During QT #2 so far, which started ramping up in the summer of 2022, the Fed has already shed $1.01 trillion.
But the Fed’s QE pile got huge during the pandemic, and there’s a lot more to take off the pile, and markets are finally waking up to it, with 10-year Treasury yields now closing in on 5% and the 20-year yield over 5%, after short-term yields have been over 5% for months.
And inflation is still about twice the Fed’s target, while during QT #1, the Fed was just trying to “normalize” its balance sheet with inflation at or below the Fed’s target:
QT on track.
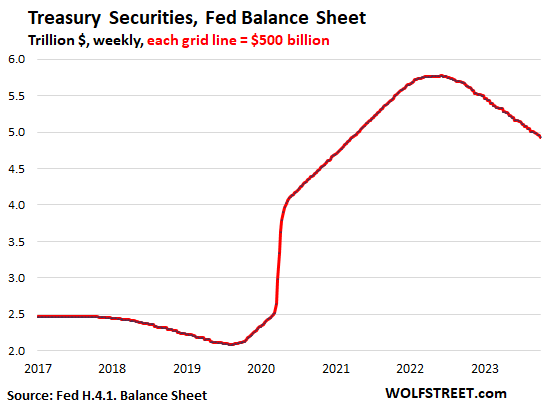
Treasury securities: -$58 billion in August, -$840 billion from peak in June 2022, to $4.93 trillion, the lowest since March 2021.
The Fed has shed 26% of the Treasury securities it bought during pandemic QE (of $3.27 trillion).
How the Fed’s QT works: Treasury notes (2- to 10-year securities) and bonds (20- & 30-year securities) “roll off” the balance sheet mid-month or at the end of the month when they mature and the Fed gets paid face value for them. The roll-off is capped at $60 billion per month, and about that much has been rolling off, minus the inflation protection the Fed earns on Treasury Inflation Protected Securities (TIPS) which is added to the principal of the TIPS.
How short-term Treasury bills fit into it. In months when the roll-off of notes and bonds is less than the cap of $60 billion, the Fed lets short-term Treasury securities (1-year or less) roll off in the amount of the shortage to get to the $60-billion cap.
These T-bills are included in the overall Treasury securities of $4.93 trillion on the Fed’s balance sheet. But by looking at them separately, we can easily see which month, and by how much, the roll-off of T-notes and T-bonds is less than $60 billion.
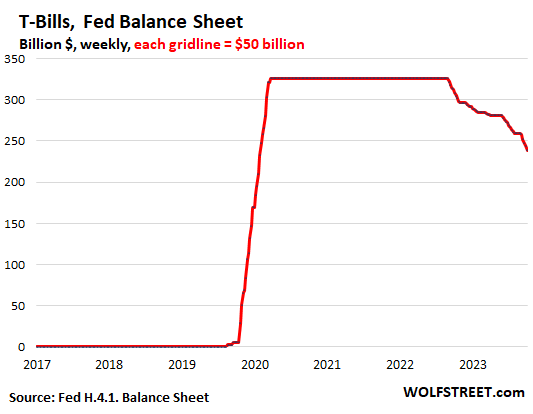
When QT started, the Fed had $326 billion in T-bills that it constantly replaced as they matured by buying new T-bills at auctions (in the auction results, “SOMA” is the Fed). This is evidenced by the flat line in the chart below.
In September, the Fed needed to let $20 billion in T-bills roll off to make up for the $20 billion by which the roll-off of T-notes and bonds was below the $60 billion cap.
Since the beginning of QT in June 2022, the Fed has burned through $67 billion of its $328-billion stash of T-bills to keep the roll-off at the cap of $60 billion. So just looking at the chart, we can guess that the Fed has enough T-bills to keep the roll-off at $60 billion for about two years. Once the T-bills are burned off, the roll-off will decline to whatever pace the then much smaller amounts of T-notes and bonds roll off.
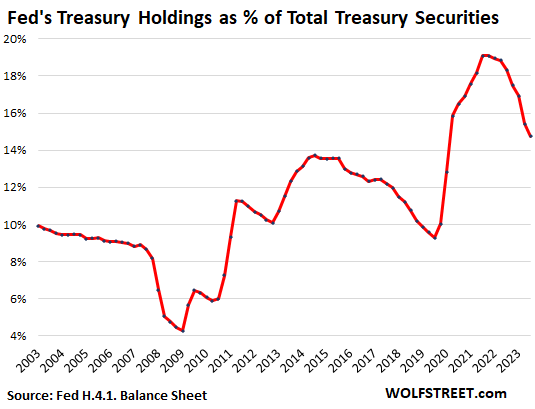
As % of gross national debt: The Fed’s holdings are now down to 14.7% of total Treasury securities outstanding at the end of September, down from 19.1% at the peak. The drop in the percentage is a result of the QT drop in Treasury securities on the Fed’s balance sheet, and the gigantic leap in the gross national debt to $33.4 trillion, amid a tsunami of new issuance of Treasury securities.
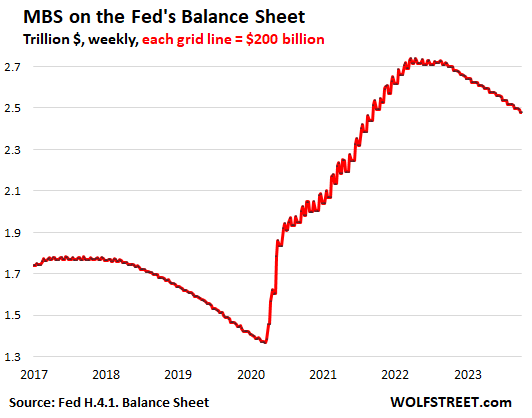
Mortgage-Backed Securities: -$19 billion in September, -$260 billion from the peak, to $2.48 trillion, the lowest since September 2021.
The Fed only holds government-backed MBS, and taxpayers carry the credit risk. MBS come off the balance sheet primarily via pass-through principal payments that holders receive when mortgages are paid off (mortgaged homes are sold, mortgages are refinanced) and when mortgage payments are made.
The spike in mortgage rates has caused home sales to plunge and refis to collapse, which slowed the mortgage payoffs, and therefore the pass-through principal payments to a trickle. So the MBS run-off has been between $15 billion and $21 billion a month, well below the $35-billion cap.
The bank-panic measures unwind.
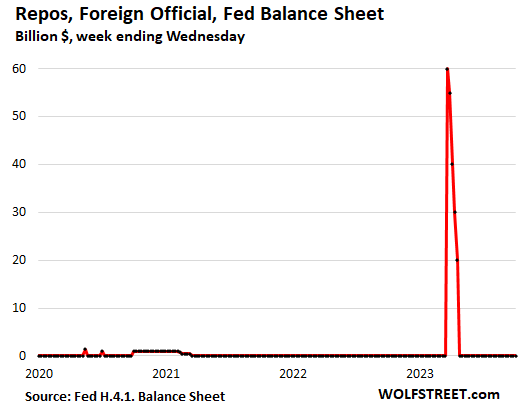
Repos with “foreign official” counterparties were paid off in April. The Swiss National Bank likely used them to fund its dollar-liquidity support for the take-under of Credit Suisse by UBS.
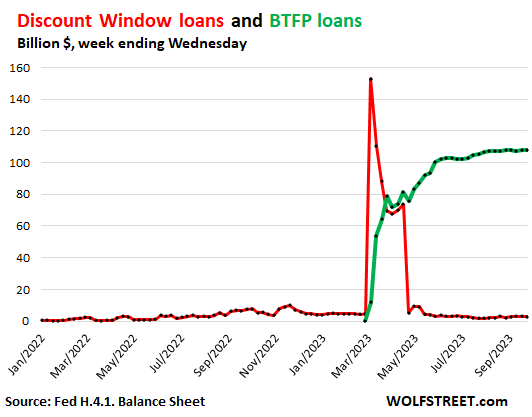
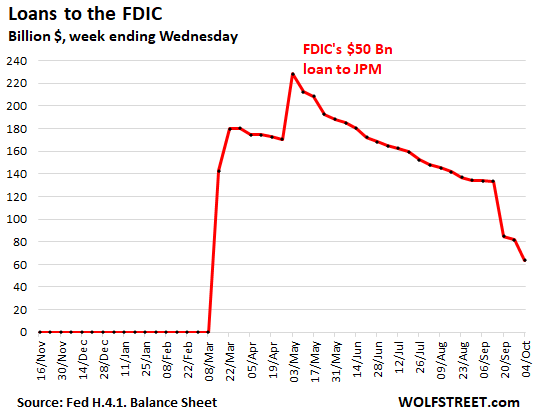
Discount Window: roughly unchanged in September, at the near-nothing level of $2.7 billion, compared to $153 billion in bank-panic March (red line in the chart below).
Discount Window lending to banks is as old as the Fed. This is expensive money: since the last rate hike, the Fed charges banks 5.5%, and banks have to post collateral under strict conditions and at “fair market value.” Banks pay off these Discount Window loans as soon as they can.
Bank Term Funding Program (BTFP): roughly unchanged in September and August, at $108 billion (green line).
The BTFP, created during the bank panic, is less punitive and more flexible than the Discount Window. Banks can borrow for up to one year, at a fixed rate, pegged to the one-year overnight index swap rate plus 10 basis points. And the collateral is valued at purchase price rather than at the lower market price.
This facility is tiny compared to the $22.8 trillion in commercial bank assets held by the 4,100 commercial banks in the US.
Loans to FDIC: -$70 billion in September, to $64 billion.
The FDIC is making progress in selling the assets that it took on with the takedowns of Silicon Valley Bank, Signature Bank, and First Republic. After the asset sales close, the FDIC sends the proceeds from the sales to the Fed to pay down the loan balance.
And here is my take on what this QT has already caused in the stock market, bond market, and Commercial Real Estate market — a lot of bloodletting — and what it will cause in those markets going forward: THE WOLF STREET REPORT: Stocks, Bonds & CRE Face QT
Enjoy reading WOLF STREET and want to support it? You can donate. I appreciate it immensely. Click on the beer and iced-tea mug to find out how:

Would you like to be notified via email when WOLF STREET publishes a new article? Sign up here.
![]()